A paper (and R package) I am currently working on requires me to sample quite a bit from a Dirichlet distribution. There are a number of nice options for doing this in many languages, including R, but as far as I am aware, none of these interface nicely with Rcpp (and are easily portable in an R package). While browsing StackExchange and Dirk Eddelbuettel's website, hoping to find a magical solution, I came across a link to the Wikipedia page on the Dirichlet_distribution. It points to a pretty simple way to sample from a Dirichlet distribution using a bunch of Gammas, which Rcpp does provide, so I decided to code it up myself! Lets take a look at the source code :
// [[Rcpp::depends(RcppArmadillo)]]
#include <RcppArmadillo.h>

// [[Rcpp::export]]
arma::mat rdirichlet_cpp(int num_samples,
                         arma::vec alpha_m) {
    int distribution_size = alpha_m.n_elem;
    // each row will be a draw from a Dirichlet
    arma::mat distribution = arma::zeros(num_samples, distribution_size);

    for (int i = 0; i < num_samples; ++i) {
        double sum_term = 0;
        // loop through the distribution and draw Gamma variables
        for (int j = 0; j < distribution_size; ++j) {
            double cur = R::rgamma(alpha_m[j],1.0);
            distribution(i,j) = cur;
            sum_term += cur;
        }
        // now normalize
        for (int j = 0; j < distribution_size; ++j) {
            distribution(i,j) = distribution(i,j)/sum_term;
        }
    }
    return(distribution);
}
I decided to try this out against the rdirichlet() functions included in the gtools and MCMCpack packages. It looks like about a 25% speedup. The more important thing is that this code is easy to stick in your Rcpp project, which makes for much faster sampling.
> alpha <- 5
> topics <- 100
> alpha_m <- rep(alpha/topics,topics)
>
> system.time({
+     temp <- gtools::rdirichlet(1000000, alpha_m)
+ })
   user  system elapsed
 11.704   0.947  13.638
>
> system.time({
+     temp2 <- MCMCpack::rdirichlet(1000000, alpha_m)
+ })
   user  system elapsed
 11.151   0.927  12.482
>
> system.time({
+     temp3 <- rdirichlet_cpp(1000000,alpha_m)
+ })
   user  system elapsed
  8.543   0.567   9.245
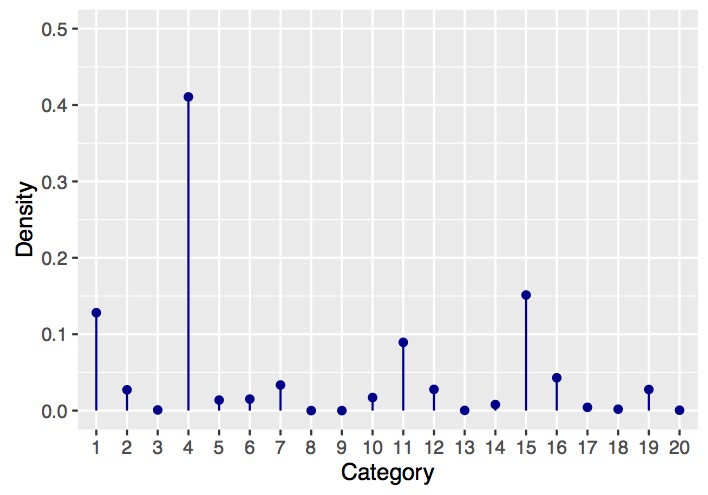
Finally, we can take a look at an example draw using the following snippet of code.
alpha <- 5
 draws <- 1
 dimen <- 20
 alpha_m <- rep(alpha/dimen, dimen)
 x <- rdirichlet_cpp(draws,alpha_m)

 dat <- data.frame(Category = factor(1:dimen),
                   Density = as.vector(t(x)))

 library(ggplot2)
 ggplot(dat,aes(x = Category,y = Density,ymin = 0, ymax = Density)) +
     geom_point(colour = "darkblue",fill = "darkblue") +
     geom_linerange(colour = "darkblue") +
     scale_y_continuous(lim=c(0,0.5))
Which produces a plot that should look something like the following:

